Detection Software to Visualize Located Structures in 3D OKM Visualizer 3D Studio


- Professional 3D imaging software for OKM metal detectors and 3D ground scanners
- Easy to use also for beginners
- Visualization of detected anomalies and structures as 2D and 3D graphics
- Determination of the position, size and depth of hidden objects
- Analysis of detected objects and structures, including documentation


plus VAT, shipping and fees


2D Visualization
3D Visualization
Volumetric 3D
3D Ground Scan
Mineral Scan
Geoelectrical Measuring Procedure
GPR
Wireless Technology
Multilingual Operation

Advanced Ground Scanning in 3D
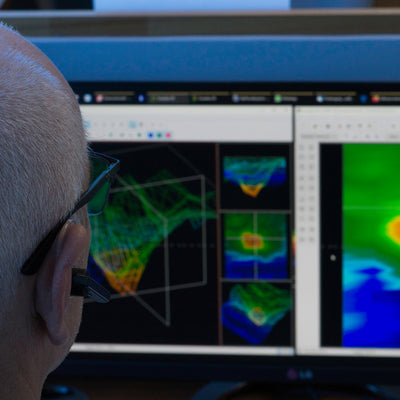
Visualizer 3D Studio offers treasure hunters, archaeologists and professional users in industry the possibility to locate and visualize hidden objects in the underground even before excavation. By using the innovative analysis software, the position, size and depth of the detected object can be determined more precisely after the measurement with the OKM detector.
- Software with intuitive operation
- Interactive support by context-sensitive help
- Automatic creation of a three-dimensional representation of the recorded measurement data after importing the raw data from the detector
- Determination of position, size and depth of the detected objects even before excavation
- Add bookmarks and supplementary notes to specific measurement points
- Automatically compile scan data as a well-structured PDF report
Software Features at a Glance
The innovative visualization software offers users a wide range of options, both in processing and in displaying and evaluating the scan data:
- Import scan data
- Edit properties and add notes
- Adjust views (rotate, scale, move)
- Use predefined viewports
- Optimize scan data with modifiers
- Select from various user interface designs
- Assign soil types (changes depth calculation and visualization)
- Select measured values
- Activate tablet mode
-
Professional EditionSet bookmarks -
Professional EditionExport data as PDF
Import Scan Data
Transfer data from the OKM detector or ground scanner via USB cable or Bluetooth and then edit it in the software. Selected detectors (Rover UC, eXp 6000) create the scan file already in .v3d format during the measurement. This can be opened directly with the software.
Edit Properties and Add Notes
In addition to the measured values, basic data such as date, length and width of the measurement field and (if activated) the associated GPS position are saved for each measurement. This information can be supplemented in the software with further information on the measurement or with information on special measuring field properties.
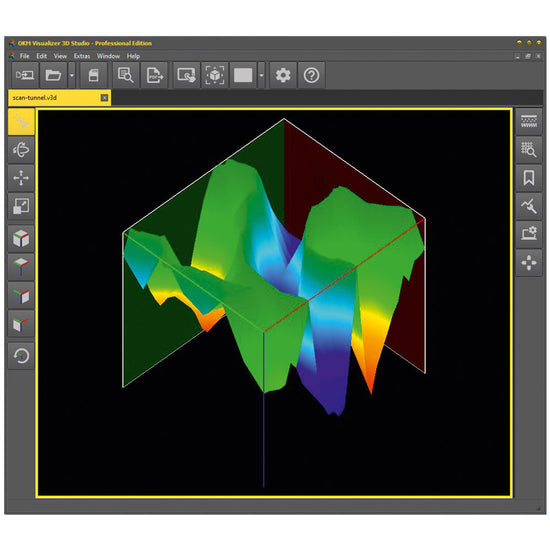
Adjust Views (Rotate, Scale, Move)
The completed scan graphic can be positioned, enlarged and rotated according to individual requirements. Thus, on the one hand a top view is possible (2D), on the other hand three-dimensional views are also possible by rotating. For easy handling, you will find preset standard views to click on in the left toolbar.


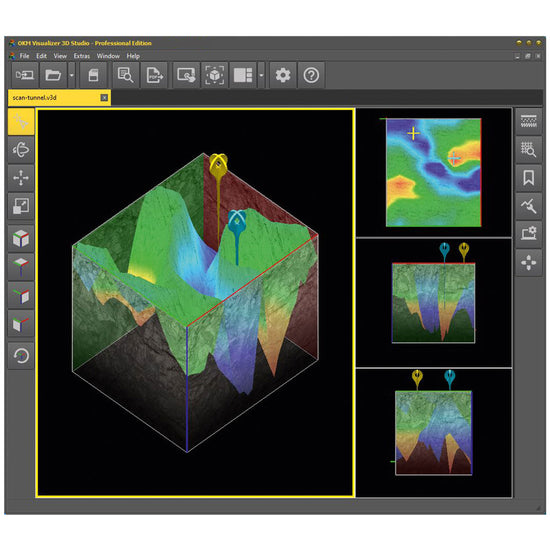
Use Predefined Viewports
Thanks to preset viewports, the scan image can be divided among several windows. This means that several perspectives can be viewed at the same time. In order to focus on a specific area, different windows in different sizes can be selected. Alternatively, the display area can be limited to a single window.


Optimize Scan Data with Modifiers
Using the four predefined modifiers (interpolation, subdivision, signal correction, rotation correction), the measured values are automatically corrected, extended by additional measuring points and recalculated in order to optimize the display and facilitate the search for potential find objects within the measured data.
Select from Various User Interface Designs
For different ambient light conditions, the software offers four user interface designs to choose from. Select the one that suits your taste!


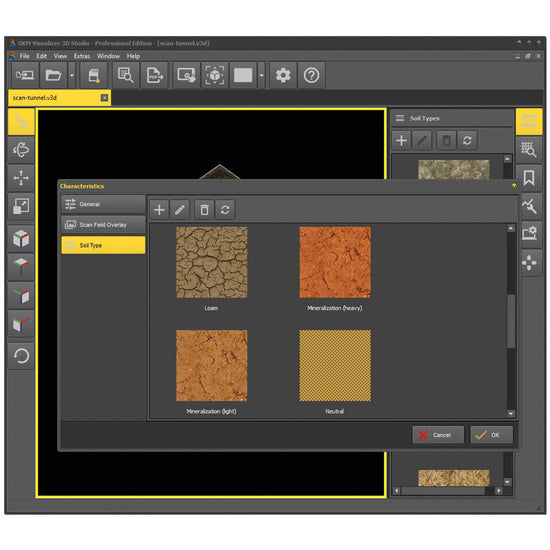
Assign Soil Types (changes Depth Calculation and Visualization)
With 12 OKM standard soil types and 12 additional USDA soil types, the new Visualizer 3D Studio software offers extended functionality: By selecting the appropriate soil type, the calculation of the depth values is adjusted according to the stored soil properties such as dielectric constant, relative permeability, homogeneity, mineralization and moisture. The selection of the correct soil type is essential, as the calculation of the measurement depth is significantly influenced by it. For a better visual evaluation the deposited soil textures can be mapped.


Select Scan Values
To select individual scan values, not only the arrow keys but now also the mouse can be used. With this function, details of the selected measured value can be viewed more easily. Furthermore, a bookmark can be set on this point that can be provided with additional information.
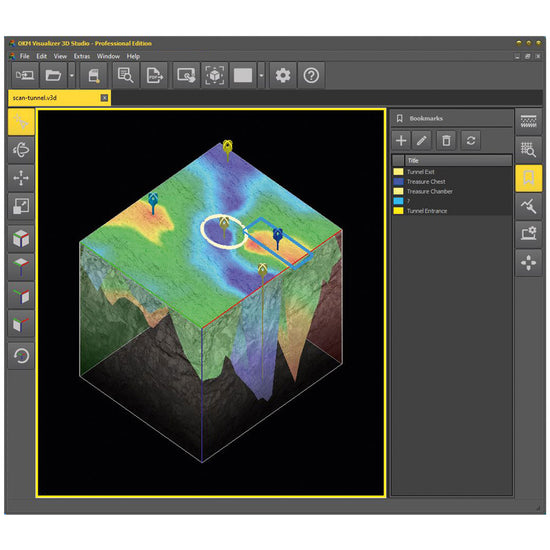
Set Bookmarks Professional Edition
Bookmarks can be used to highlight areas of interest and potential findings. A pin on the selected measurement marks a point for which further details can be noted. Optionally, a rectangle or circle can be placed around the point to highlight an entire area.


Export Data as PDF Professional Edition
Until now, the scan image was only available to be printed directly or exported as an image. This function has been adopted for the Standard Edition and even extended for the Professional Edition: With the PRO version, you can have your scan data automatically compiled. Decide for yourself whether with or without image, scan information, details on soil types and/or set bookmarks.


Activate Tablet Mode
When using the Visualizer 3D Studio software on a tablet or laptop with a smaller screen, it is recommended to activate the tablet mode. This will optimize the display of the import process and improve its visibility.
New Features for Advanced Ground Scan Analyses
The OKM software has continued to advance along with the detectors and the requirements of the users. Thus, numerous useful functionalities have been added to facilitate the use of the software and to make the evaluation of the scan data more efficient.
New features include:
- Benefit from additional visualization options
- Set Individual Bookmarks
- Add Individual Soil Types
- Include Scan Field Photo
- Generate PDF Report
- Additional Preset Soil Types
- Advanced Settings
Discover more advantages of the new analysis software and its editions Standard and Professional!
Easy-to-Use Software - also for Inexperienced Users
Easy-to-understand icons and direct tooltips enable intuitive operation. Sample scans available in the program show users which graphic details may indicate potential targets such as buried treasure chests and artifacts, underground tunnels, burial chambers and underground pipelines.
In addition, users are supported by an interactive help system. This and the online help are currently available in English and German.
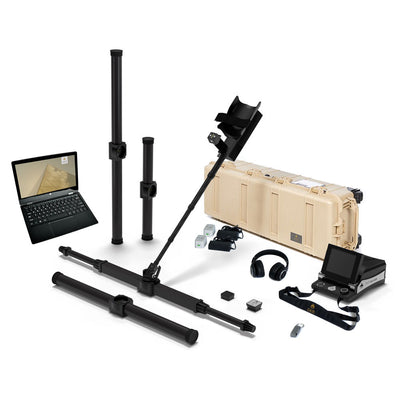
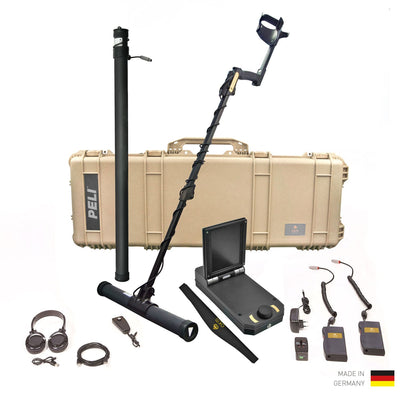
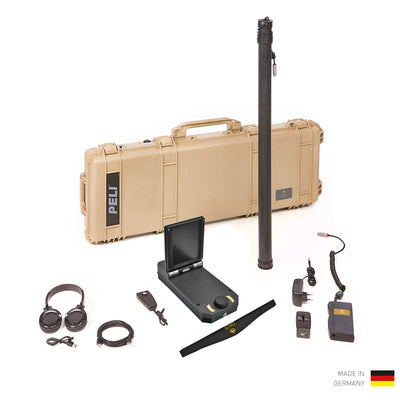
Supported Detectors
The scan analysis software Visualizer 3D Studio has been especially designed for OKM metal detectors, 3D ground scanners, water detectors and ground penetrating radar.
OKM Fusion Light
Metal Detector and 3D Ground Scanner for Entry-Level Detectorists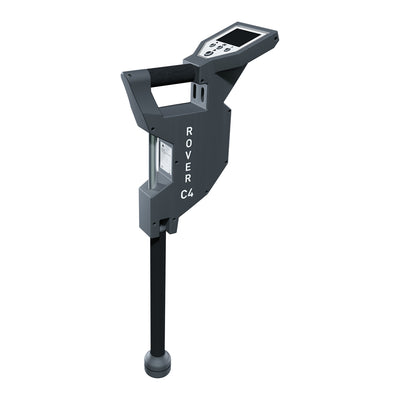
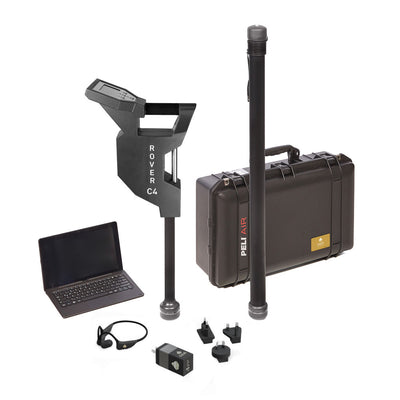
OKM Rover C4
Gold Detector and Absolute Favorite for Treasure Hunting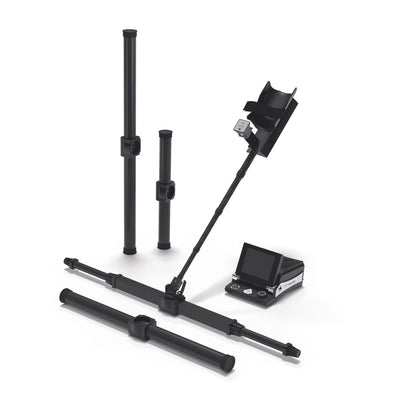
OKM eXp 6000 Professional Plus
Best Detector with various modes including vertical and horizontal scan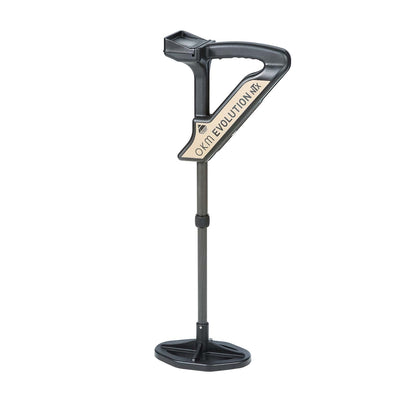
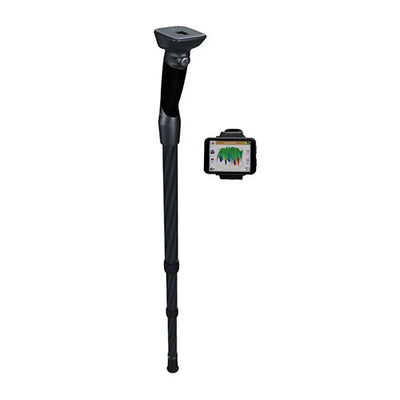
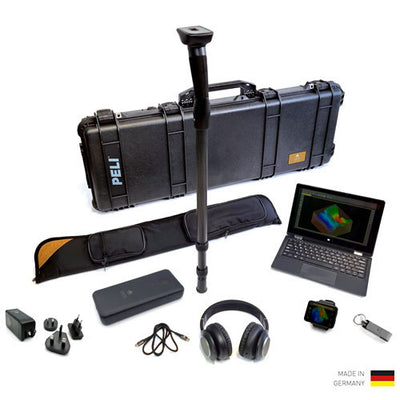
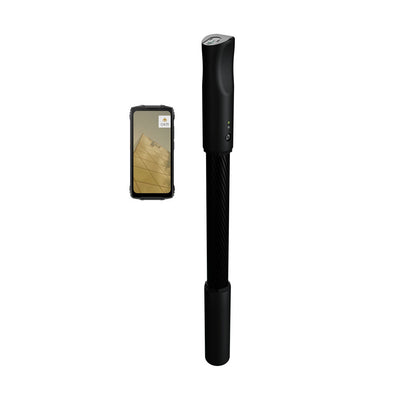
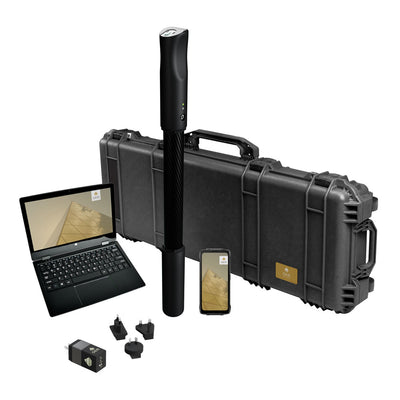
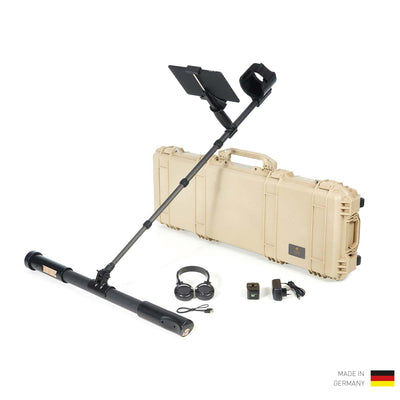
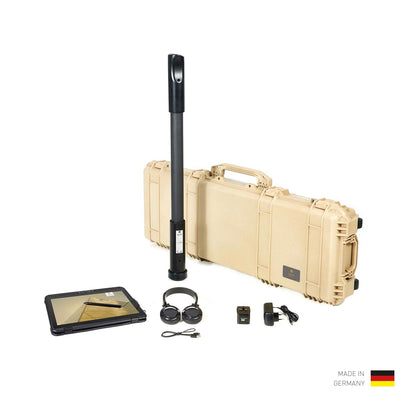
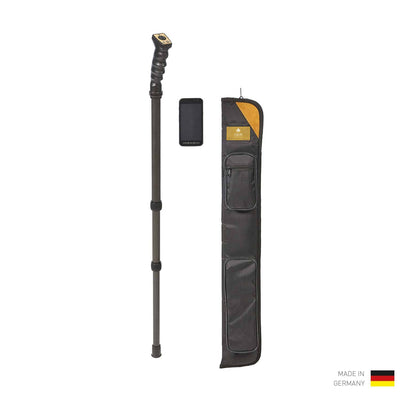
OKM Rover UC
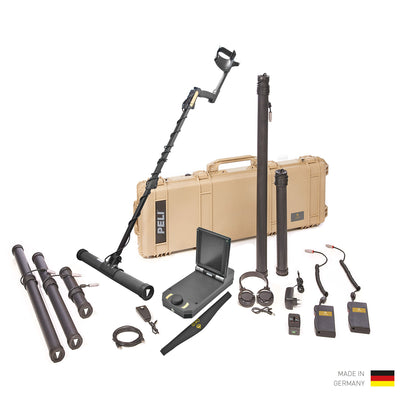
Metal Detector disguised as Trekking Pole with Smartwatch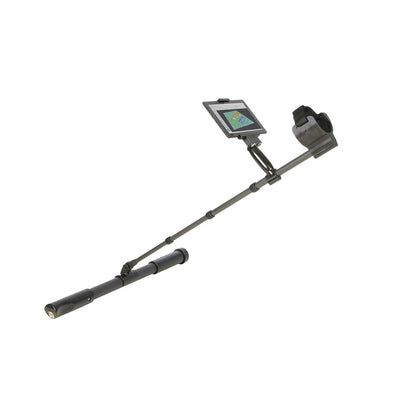
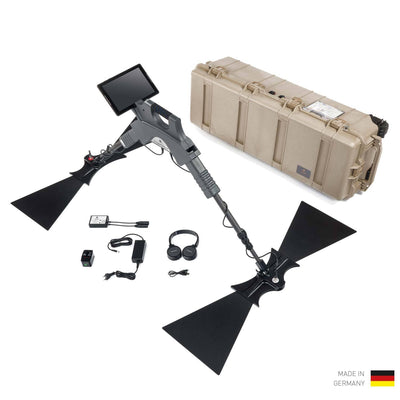
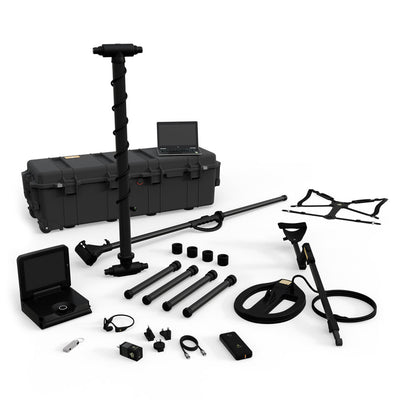
OKM Fusion Professional Plus
Metal Detector with Live Scan Detection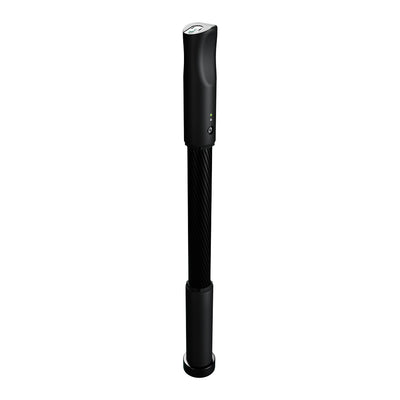
OKM Fusion Professional
Metal Detector with SRIS Coil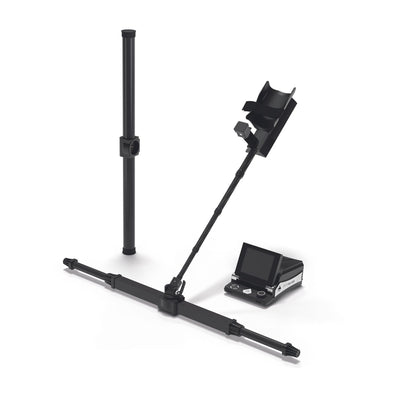
OKM eXp 6000 Professional
Gold Detector with Depth Range down to 25 m (82 ft)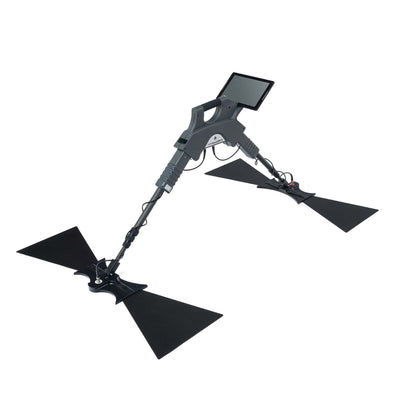
OKM Gepard GPR 3D
Ground Penetrating Radar with Depth Performance down to 40 m (132 ft)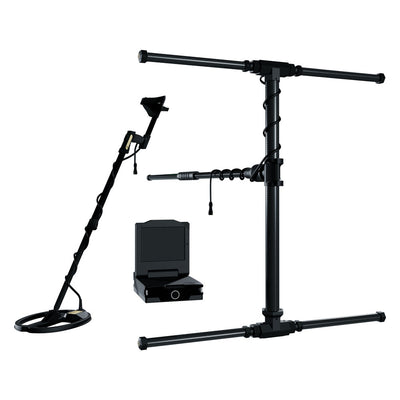
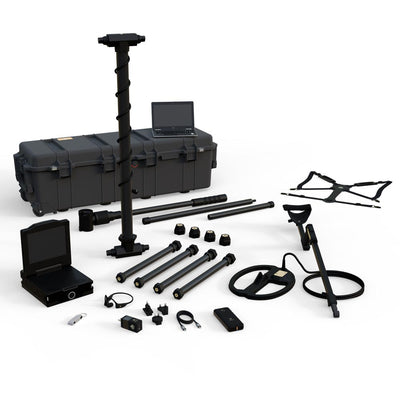
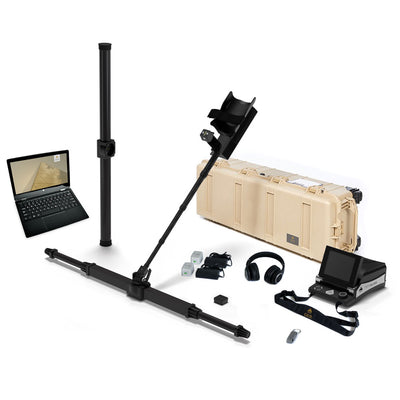
OKM eXp 7000 Professional Plus
Premium 3D Ground Scanner with Advanced Detection Tech Mix incl. VLF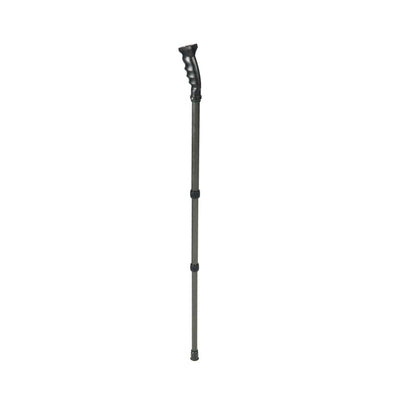
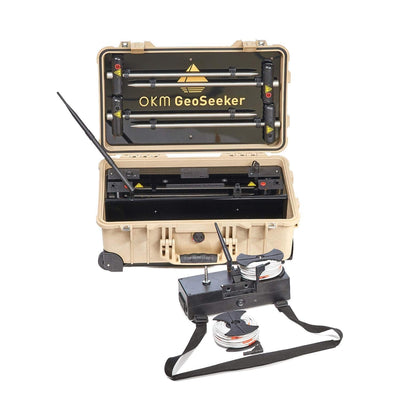
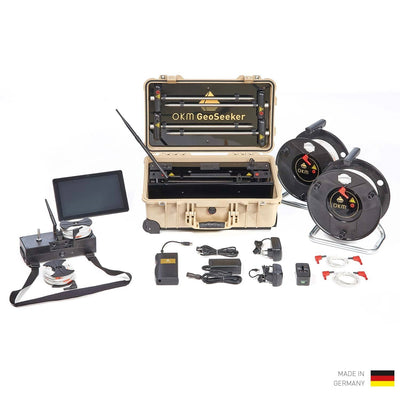
OKM GeoSeeker
Water Detector down to 250m (820 ft)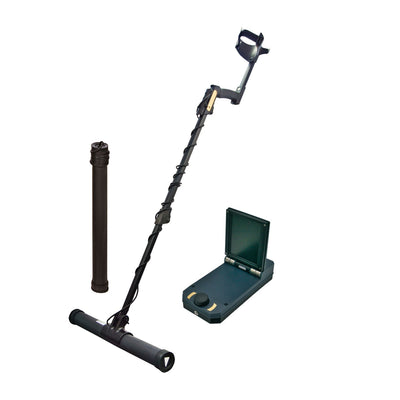
OKM eXp 4500 Professional Plus (2020-2023)
Gold Detector for Professional Detectorists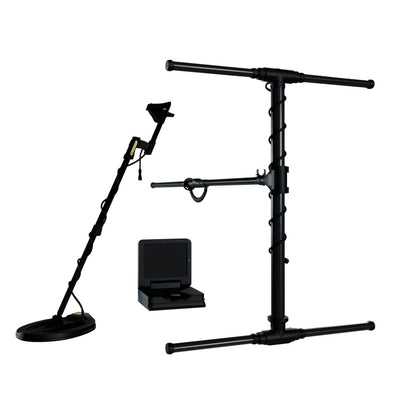
OKM eXp 5500 Professional
Multi-Technology Detector with VLF and 3D Ground Scan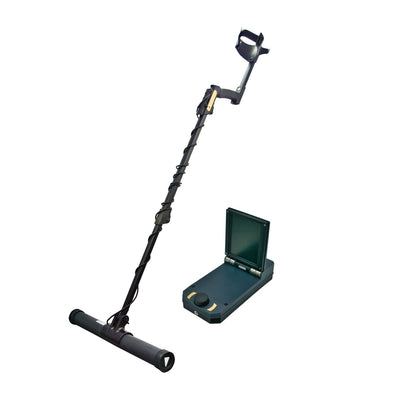
OKM eXp 4500 Professional (2020-2023)
Gold Detector and 3D Ground Scanner with Interchangeable Probes

Compatible Current OKM Detectors
- Delta Ranger
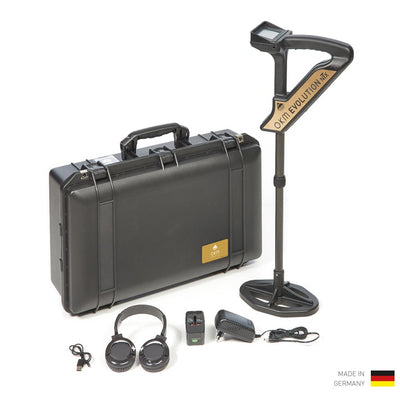
- Evolution NTX
- eXp 5500
- eXp 7000
- Fusion Light
- Fusion Professional
- Fusion Professional Plus
- GeoSeeker
- Gepard GPR 3D
- Ground Navigator 2.0
- Rover C4
- Rover UC
Moreover, the various editions of the ground scan analysis software - Visualizer 3D Standard and Professional - are also compatible with most previous detectors.
Previous Detectors (Data Transfer)
- Evolution
- Future I-160
- Future 2018
- GEMS
- Ground Navigator
- eXp 4000
- eXp 4500
- eXp 5000
- eXp 6000
- Rover C - New Edition
- Rover C II - New Edition
- Rover Deluxe - New Edition
- Rover Gold
In addition, all saved scan files in *.v3d format such as 3D Ground Scan and Mineral Scan, which were performed with older OKM ground scanners and metal detectors, can also be opened in the new Visualizer 3D Studio software. This allows to view, edit and analyze the scan data with the new software, which offers new functions and tools.
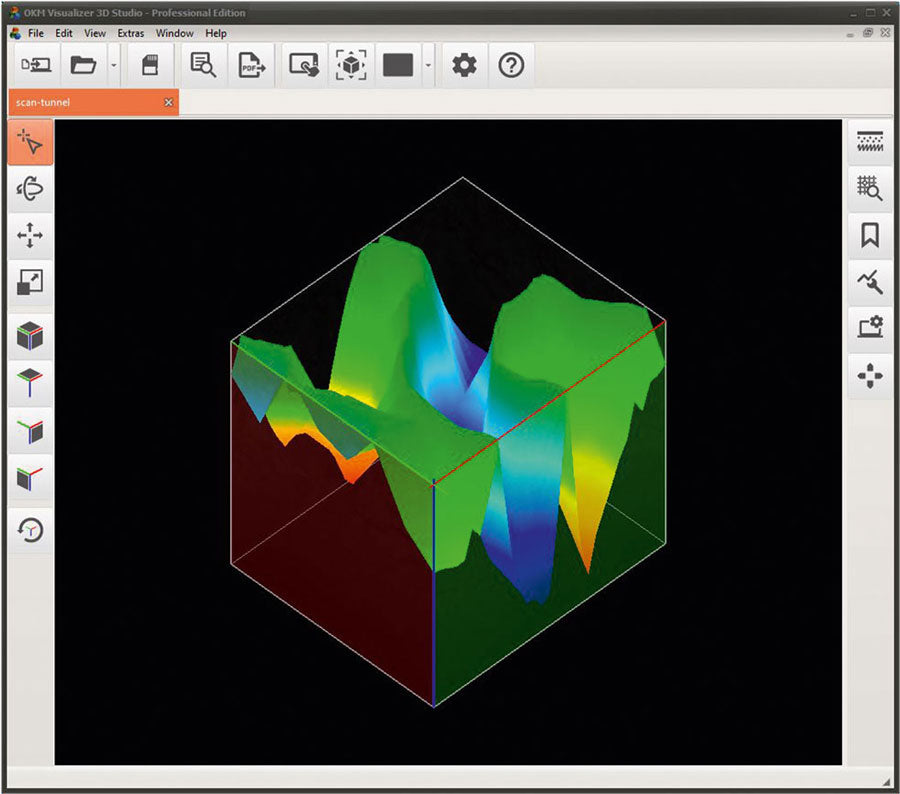
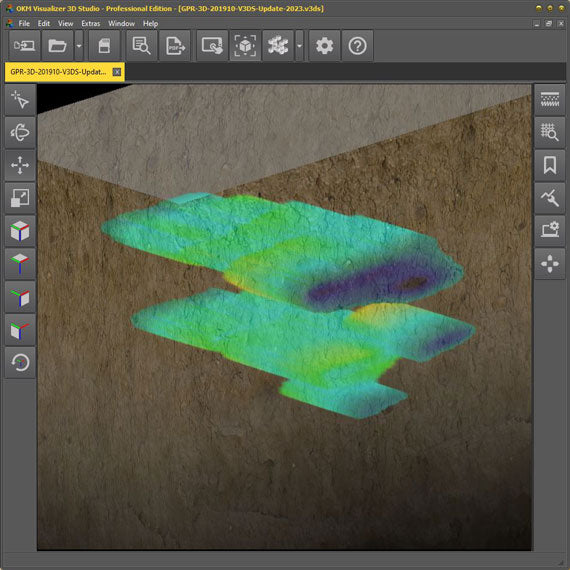
Scan Analysis in Visualizer 3D Studio
3D Ground Scan in Perspective 3D
By using bookmarks, potential finds can be highlighted and labeled directly in the program. This saves time-consuming processing of scan images in additional programs.
The bookmarks can be saved with the scan file and thus also sent to external viewers (Visualizer 3D Studio software required). The set bookmarks can also be viewed in the Standard Edition. Setting and editing bookmarks is only possible in the Professional Edition.
Gepard GPR Scan in Radargram 2D Professional Edition
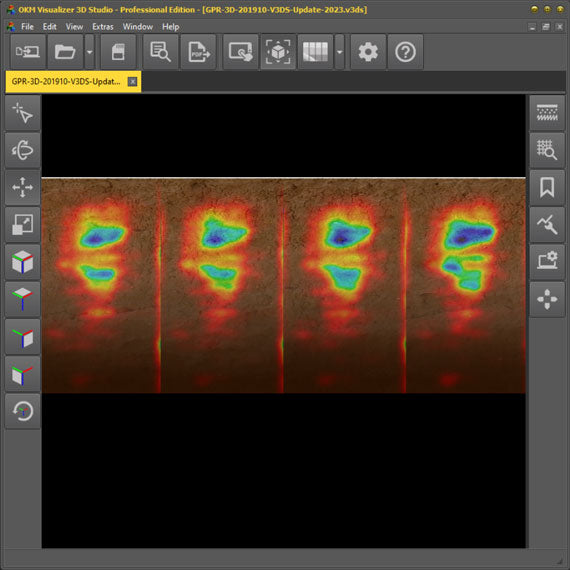
The Radargram 2D render view allows viewing the detected structures as users are already familiar with from the GPR app.
Gepard GPR Scan in Volumetric 3D Professional Edition
The Volumetric 3D render view allows optimizing the visualization of detected structures by adjusting smoothing and threshold. Moreover, for GPR, further soil types are available in Visualizer 3D.
GeoSeeker Scan in Volumetric 3D Professional Edition
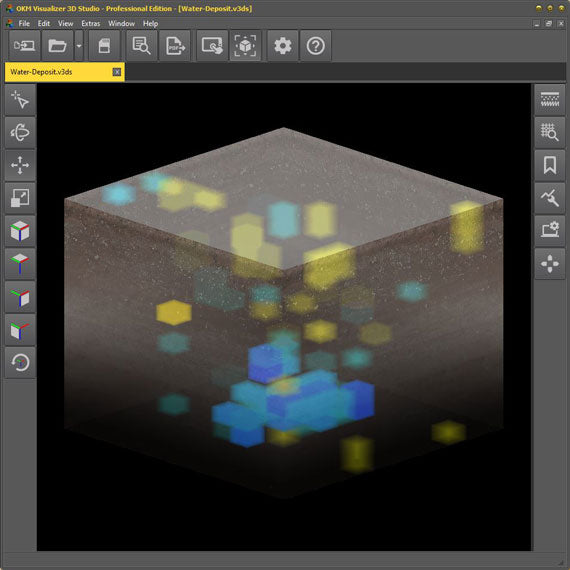
The Volumetric 3D render view for GeoSeeker scans allows visualizing water deposits and voids in Visualizer 3D Studio for detailed analyses of geoelectrical scan data.
For easier and faster exchange with colleagues and clients, the scan data can be organized in a PDF report. When exporting, you can individually include or exclude scan image (current screen view), scan information, soil type information and set bookmarks.
Software Documentation: Interactive Help Replaces the Manual
For efficient use of the software, OKM relies on interactive help: Depending on the function, appropriate notes are displayed when help is activated. Additionally, tooltips as well as shortcuts in the status bar (lower window border) help with the usage. With the online help - the so-called documentation - you are always up-to-date. You can browse through it without any software update; all you need is an Internet connection.
- language-independent symbols
- intuitive interface and functions
- tooltips at function keys
- context-sensitive help directly in the software (offline)
- documentation always up to date (online)
If you cannot find answers to your questions in the help/documentation, software tutorial videos provide further support. Examples are used here to show the software functions in detail.
Archaeology
Treasure Hunting
Natural Gold Prospecting
Cavity Detection
Militaria Detection
Agriculture
Forensics
Public Services
Geotechnical Engineering
Water Detection / Well Building
Explosive Ordnance Disposal Services
OKM Search Services
- Software Key for Download, Installation and Activation
- Incl. 4 Licenses (Activation Codes)
Computer Minimum Requirements
- Free Disk Space: 250 MB
- Working Memory: 2 GB
- Graphics Card: 1 GB RAM, OpenGL 3.3
- Display: 1920 x 1080
- Processor: 1.2 GHz
- Operating System: Windows 10, Windows 8.1, Windows 7
- Interface: USB 2.0 for data import from OKM detector
The technical data are average values. Minor deviations are possible during operation.

OKM has a high accuracy in receiving and analyzing data, the lowest amount of noise, ease of working with the device and the wonderful visualizer3d analysis software. In my opinion, you are excellent in the software and analysis department.

I am using the fusion light from OKM and I am amazed with the results of the test scans then I really love the software late update that was released lately. I love it so much very useful ,very helpful for both amateur and advanced users. Dear friends of OKM be proud because you have between your hands a piece of artwork and an efficient device with a lots of support served gently from a friendly team OKM.I am talking about my own personal experiences with OKM device Fusion light on real field and my whatsup communications with OKM engineers. Robust, reliable, versatile, up to date technology be confident because it Is made In Germany.
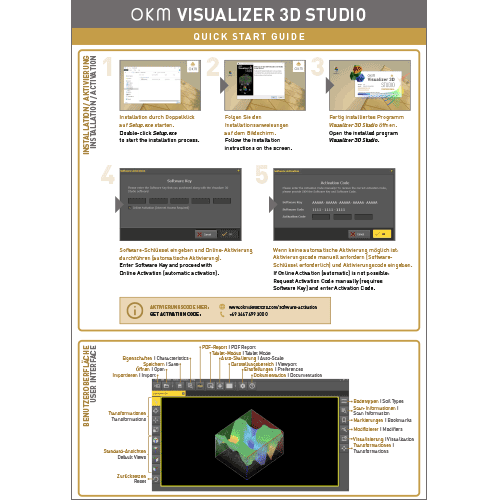
Visualizer 3D Studio
Quick Start Guide
Languages: English, Deutsch
Last updated: March 23, 2026
File size: 900 kB